

|
Navigation: Wall Thickness: Heat Map |
Scroll
 | |
|

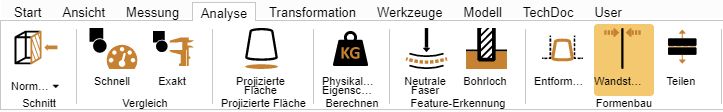
The wall thickness function: Heatmap can be accessed via the Analyze > Heat map tab.
In contrast to the punctual wall thickness measurements (Measurement tab), the entire surface of a selection is colored in the wall thickness heat map analysis. The color assigned to the wall thickness can be taken from the color scale on the right edge of the model area.
Analogous to the wall thickness measurement, the wall thickness heat map can be calculated on the basis of the ray based or rolling ball (sphere) method (see paragraph below). The default settings allow you to choose between both methods and a faster, more detailed or user-defined calculation.
Difference between ray based and rolling ball (sphere) methods
To illustrate the difference and the value of the two methods, it is useful to display the tessellation by pressing the [F9] key (the left screenshot in the examples below). In general, higher tessellation qualities (more triangles) offer more detailed results .
Ray based
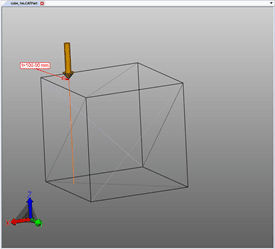
The following screenshot shows a punctual wall thickness measurement on the left (tab Measurement > Wall thickness > Ray). The orange mouse pointer stands perpendicular to the underlying tessellation triangle. To determine the wall thickness, a ray perpendicular to the triangular surface was fired at this point until another triangle was hit. The two penetration points generated in this way define the distance or wall thickness measured here.
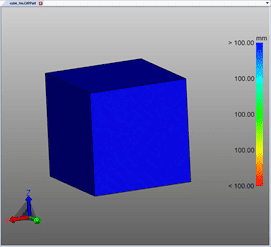
To calculate the wall thickness heat map (screenshot on the right), the number of triangles is increased depending on the setting or default setting and a ray is fired at the triangle center of gravity for each triangle. The model is colored interpolated according to the determined distances over the triangles.
Rolling ball (Sphere)
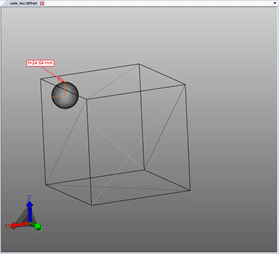
The following screenshot shows a punctual wall thickness measurement on the left (tab Measurement > Wall thickness > Sphere). At the clicked point, a sphere is created tangentially and extended until the sphere touches another triangle of the tessellation. The diameter of the sphere indicates the wall thickness.
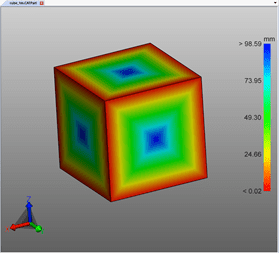
To calculate the wall thickness heat map (screenshot on the right), the number of triangles is increased depending on the setting or default setting and a sphere is created at the triangle center of gravity for each triangle. The model is colored interpolated according to the determined diameter over the triangles.
Create wall thickness heat map
Proceed as follows to generate a wall thickness heat map:
▪Activate the Wall thickness function via the Analyze tab.
▪Select the parts for sampling. Without selection the wall thickness is calculated for all visible parts.
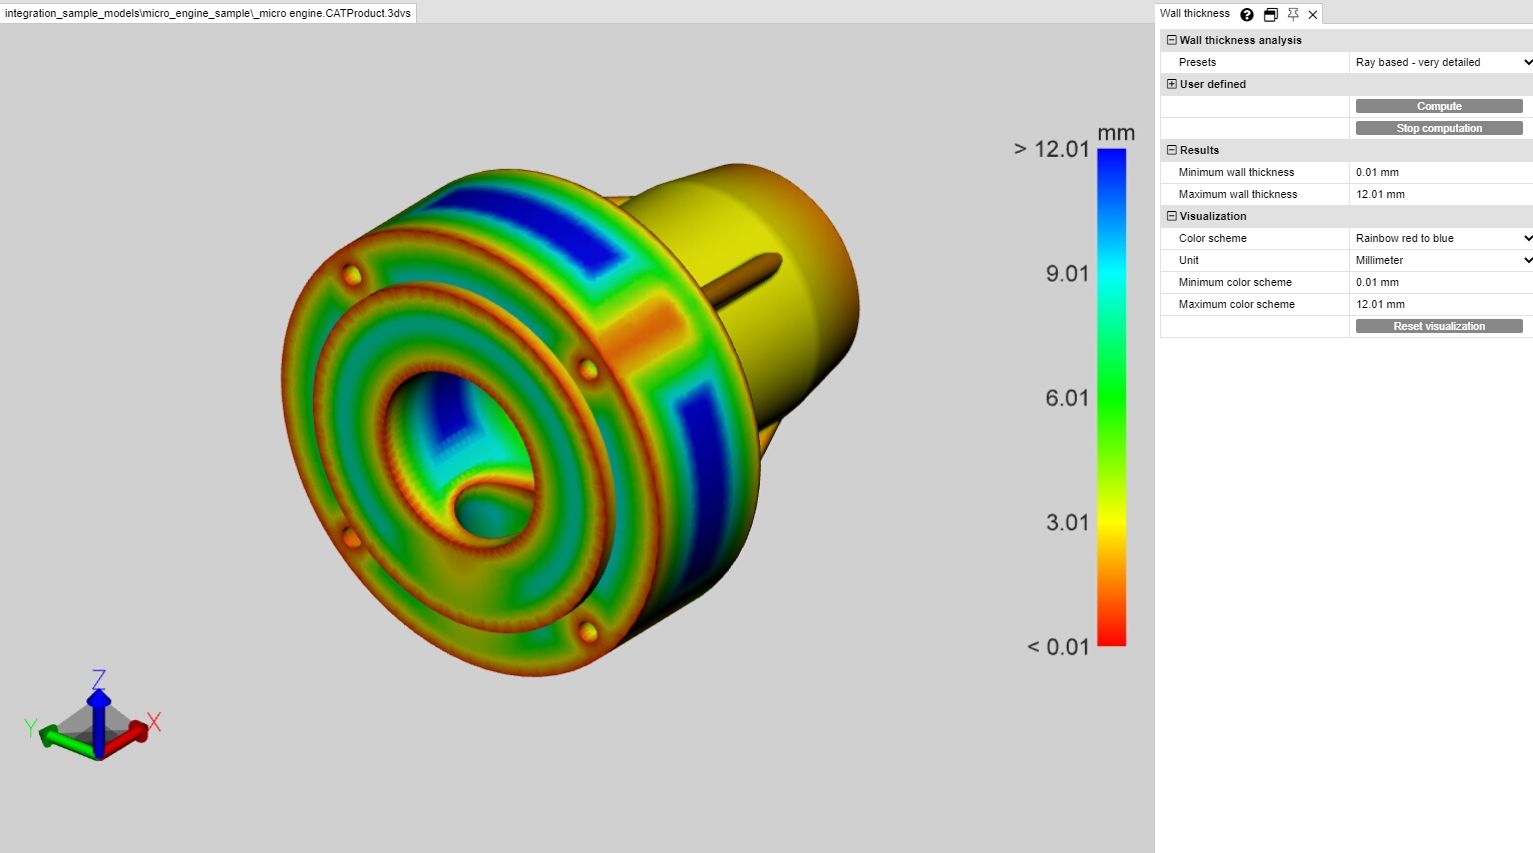
▪A preset can be selected or user-defined settings can be made in the tool window.
▪Click the [Compute] button. The calculation duration depends on the combination of tessellation quality, settings/presettings, selection and the available computing power.
▪Once the process is complete, the original geometry disappears and the wall thickness analysis result is displayed.
Further information:
▪The wall thickness heat map is anchored as a new geometry Wall thickness calculation under the CreatedNodes/HeatMapSet node. Like other geometries, the heat map can be hidden, scaled and edited (see chapter Selection Mode to Hide, Delete and Ghost Objects).
▪The color scheme of the legend is initially adjusted to the computed minimum and maximum values. They correspond to the values in the Results section.
▪For better visualization, the interval of the color scheme can be limited to the respective wall thicknesses (see figure below), in order to visualize small changes in wall thickness at certain intervals.
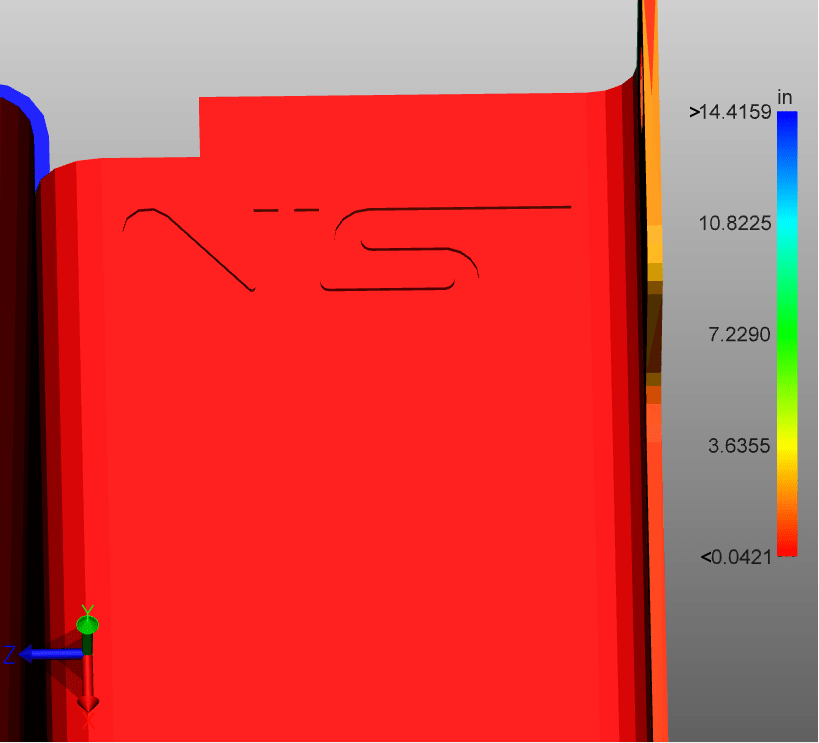
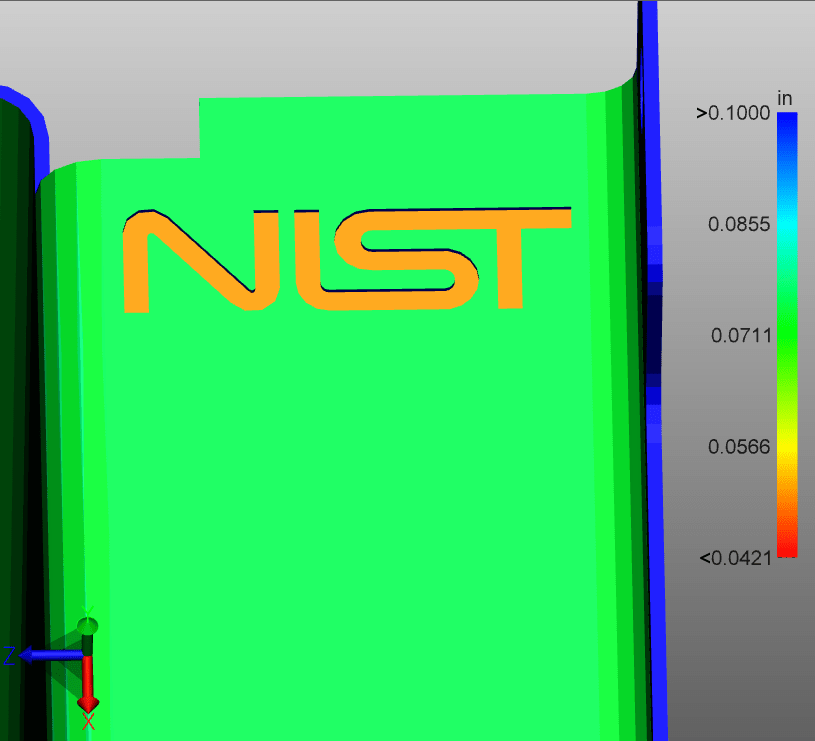
▪In the following images you first see the result with the calculated maximum and minimum wall thickness, followed by a visualization with manually restricted maximum wall thickness, whereby the lettering becomes visible.
In the bottom right figure, only the maximum value of the legend is limited to 0.1 inches. Thus, all wall thicknesses greater than 0.1 inch are colored blue, but the entire color scheme is now divided into the interval of 0.0421 and 0.1 inch. As a result, the lettering becomes visible, since this small change in wall thickness is already assigned to a new color.
The heat map of the wall thickness analysis can be saved in a view as usual (see chapter Views).